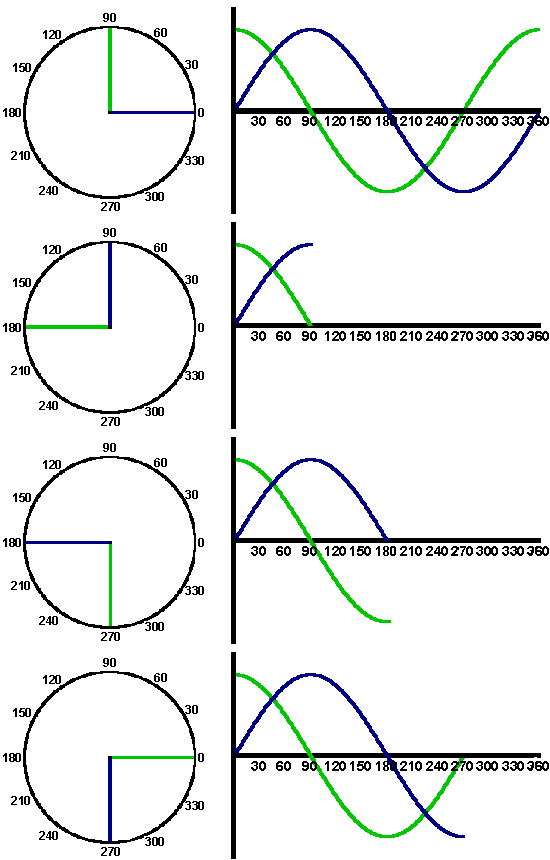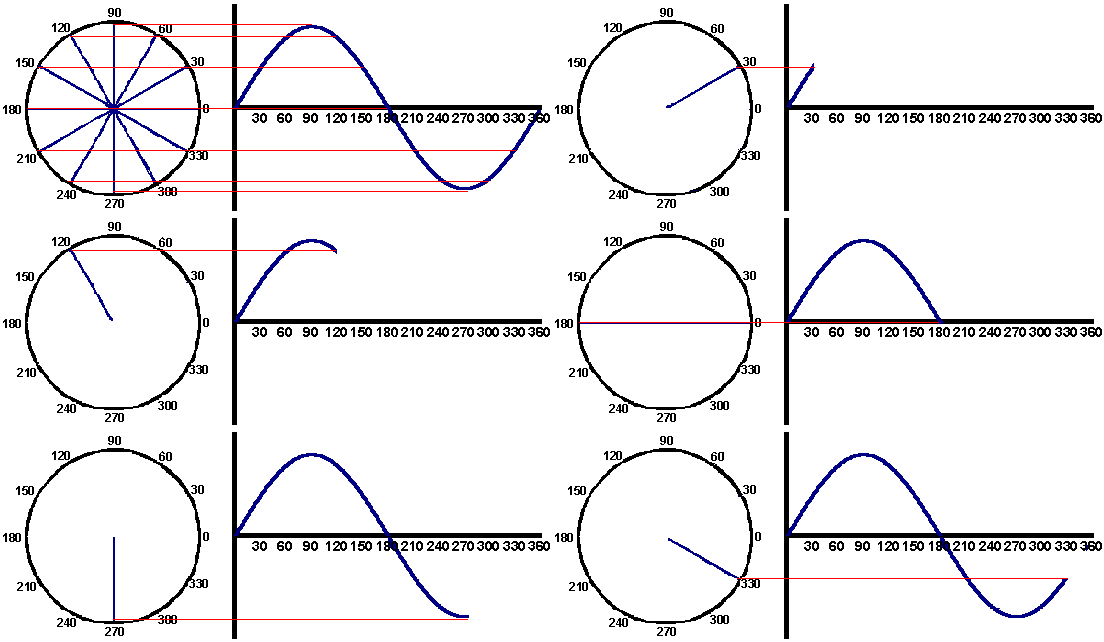

This diagram explains the impedance behavior of AC circuits, showing how voltage and current signals can differ in magnitude and phase.
Impedance represents the total opposition a circuit offers to alternating current, especially when capacitors or inductors are present.
It is widely used in AC analysis, filters, signal processing, and power systems.
Key Components:
- Impedance (Z): The opposition to AC flow, combining resistance and reactance.
- Sinusoidal Voltage & Current: AC signals represented as waveforms that may lead or lag each other.
- Phase Angle (θ): Shows the time shift between the voltage and current waveforms.
- Phasor Diagram: A rotating vector representation of sine waves showing magnitude and phase clearly.
- Bode Plot: Graphs that show how magnitude and phase change with frequency on a logarithmic scale.
Working Principle:
When a sinusoidal voltage is applied to a circuit, the current may not align perfectly with the voltage.
In resistive circuits, voltage and current are in phase, but in circuits with inductors or capacitors, they shift in phase (lead or lag).
Phasors help visualize these relationships by converting sine waves into rotating vectors, making it easy to compare multiple signals.
Bode plots offer another way to present this information by showing:
- How magnitude changes across frequencies
- How phase angle shifts with frequency
This makes them extremely useful for analyzing RC, RL, and RLC circuits and understanding how they behave at different frequencies.
⚡ Tip:
Use phasor diagrams for quick phase comparison and Bode plots for wide-frequency analysis—both are essential tools for accurate AC circuit understanding.


